By David Lin (linkewei :at: stanford.edu)
Introduction
In this article, we explore some applications of information-theoretic methods to various combinatorial problems. The various approaches are best thought of as an extension to the probabilistic method, first initiated by Paul Erdős in the 1940s, where a probability distribution imposed on combinatorial objects (e.g. a randomly selected element of a set) can give rise to deterministic conclusions that are otherwise difficult to obtain.
The probabilistic method usually depends on computing the expected value (where we obtain a “typical” value), or showing that the probability of an event is positive (i.e. the probability of constructing a desired object). Information theory forms a natural extension to this method by offering additional quantities to consider, since entropy and mutual information possess intuitive significance once a random distribution is imposed on the objects.
Information Theory Preliminaries
When we construct a (discrete) random variable taking values among a set
  , the entropy is defined as
![H(X) \overset{\scriptscriptstyle\Delta}= \mathbb E[-\log p_X(X)] = \sum_{x\in \mathcal X} -p_X(x) \log p_X(x)](https://s0.wp.com/latex.php?latex=H%28X%29+%5Coverset%7B%5Cscriptscriptstyle%5CDelta%7D%3D+%5Cmathbb+E%5B-%5Clog+p_X%28X%29%5D+%3D+%5Csum_%7Bx%5Cin+%5Cmathcal+X%7D+-p_X%28x%29+%5Clog+p_X%28x%29&bg=ffffff&fg=7f8d8c&s=0&c=20201002) where all logs are base 2 and by convention
where all logs are base 2 and by convention  . Following the analogy, if we have a second random variable
  taking values on
  , we have the concepts of joint entropy and conditional entropy :
![\begin{aligned} H(X,Y) &\overset{\scriptscriptstyle\Delta}= \mathbb E[-\log p_{X,Y}(X,Y)] = \sum_{(x,y)\in \mathcal X\times \mathcal Y} -p_{X,Y}(x,y) \log p_{X,Y}(x,y)\\ H(Y|X) &\overset{\scriptscriptstyle\Delta}= \mathbb E[H(Y|X=x)] = \mathbb E[-\log p_{Y|X}] = \sum_{(x,y)\in \mathcal X \times \mathcal Y} - p_{X,Y}(x,y) \log p_{Y|X=x}(y) \end{aligned}](https://s0.wp.com/latex.php?latex=%5Cbegin%7Baligned%7D+H%28X%2CY%29+%26%5Coverset%7B%5Cscriptscriptstyle%5CDelta%7D%3D+%5Cmathbb+E%5B-%5Clog+p_%7BX%2CY%7D%28X%2CY%29%5D+%3D+%5Csum_%7B%28x%2Cy%29%5Cin+%5Cmathcal+X%5Ctimes+%5Cmathcal+Y%7D+-p_%7BX%2CY%7D%28x%2Cy%29+%5Clog+p_%7BX%2CY%7D%28x%2Cy%29%5C%5C+H%28Y%7CX%29+%26%5Coverset%7B%5Cscriptscriptstyle%5CDelta%7D%3D+%5Cmathbb+E%5BH%28Y%7CX%3Dx%29%5D+%3D+%5Cmathbb+E%5B-%5Clog+p_%7BY%7CX%7D%5D+%3D+%5Csum_%7B%28x%2Cy%29%5Cin+%5Cmathcal+X+%5Ctimes+%5Cmathcal+Y%7D+-+p_%7BX%2CY%7D%28x%2Cy%29+%5Clog+p_%7BY%7CX%3Dx%7D%28y%29+%5Cend%7Baligned%7D&bg=ffffff&fg=7f8d8c&s=0&c=20201002) There is a natural information-based interpretation for the above.
There is a natural information-based interpretation for the above.  is a measure of the combined information of and (or equivalently, the measure of the information of
  as a joint variable), while
  is the measure of the expected information revealed by about .
These two quantities are also related by the chain rule:
Fact. (Chain Rule)
 .
.
(Interpretation: the information of revealing
and is equivalent to the information of revealing then revealing .)
A key inequality is as follows:
Fact. (Data Processing Inequality)
 .
(Interpretation: revealing additional information cannot increase entropy)
.
(Interpretation: revealing additional information cannot increase entropy)
Remark. As a quick corollary, we have the much simpler
 , which when combined with the chain rule gives us the subadditivity of entropy.
Entropic Lower Bounds
A basic property is that the entropy gives a lower bound on the number of distinct values can take:
Fact.
 .
.
This immediately gives us a way to connect entropy and counting: we can bound any count we want by setting up some distribution over the desired object, and then estimating the entropy.
Problem. Let
 be a bipartite graph with vertex partitions of size
  and
and  respectively. If
  is the set of length 3 paths (edges may be repeated), then

Solution. We will select a random length 3 path
 as follows:
  is uniformly selected among all edges, then
  is uniformly selected among all edges at
  and
and  is uniformly selected among all edges at
  independent of .
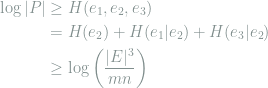
First we compute
![H[e_1|e_2]](https://s0.wp.com/latex.php?latex=H%5Be_1%7Ce_2%5D&bg=ffffff&fg=7f8d8c&s=0&c=20201002) :
:
![\begin{aligned} H[e_1|e_2] &= \sum_{u\in U}\frac{\deg u}{|E|}\log (\deg u)\\ &\ge \frac{m}{|E|}\left(\frac{|E|}{m}\log\left(\frac{|E|}{m}\right)\right) = \log\left(\frac{|E|}{m}\right)\\ \end{aligned}](https://s0.wp.com/latex.php?latex=%5Cbegin%7Baligned%7D+H%5Be_1%7Ce_2%5D+%26%3D+%5Csum_%7Bu%5Cin+U%7D%5Cfrac%7B%5Cdeg+u%7D%7B%7CE%7C%7D%5Clog+%28%5Cdeg+u%29%5C%5C+%26%5Cge+%5Cfrac%7Bm%7D%7B%7CE%7C%7D%5Cleft%28%5Cfrac%7B%7CE%7C%7D%7Bm%7D%5Clog%5Cleft%28%5Cfrac%7B%7CE%7C%7D%7Bm%7D%5Cright%29%5Cright%29+%3D+%5Clog%5Cleft%28%5Cfrac%7B%7CE%7C%7D%7Bm%7D%5Cright%29%5C%5C+%5Cend%7Baligned%7D&bg=ffffff&fg=7f8d8c&s=0&c=20201002)
Similarly
![H[e_3|e_2]\ge \log\left(\frac{|E|}{n}\right)](https://s0.wp.com/latex.php?latex=H%5Be_3%7Ce_2%5D%5Cge+%5Clog%5Cleft%28%5Cfrac%7B%7CE%7C%7D%7Bn%7D%5Cright%29&bg=ffffff&fg=7f8d8c&s=0&c=20201002) . Then:
. Then:
Discussion.
- This is clearly tight for complete graphs.
- The way to invent this solution is firstly to notice the naive argument that gives the RHS: picking
,
shares the
-vertex with probability
while
-vertex with probability
. Hence the probability of
if we make the naive assumption that the two events are independent.
This leads us to the correct solution when we impose such a distribution on the set of 3-paths, then the entropic counting bound gives us the right answer.
Problem. Given finite sets
 and functions
  , a vector
  is called nice if
  for each
  . Show that the number of nice vectors is at least

Solution. Select
 uniformly at random, and select
  among the possible choices (given ) uniformly at random, and so on. The probability of
  being any particular value of is fixed at
  . So:
. So:
![\begin{aligned} H[x_1,x_2,...,x_n] &= H[x_1] + H[x_2|x_1] + H[x_3 | x_1,x_2]...\\ &= \log |X| + \mathbb{E}\left[\log \deg x_1\right] + \mathbb{E}\left[\log \deg x_2\right]...\\ &\ge \log |X| - \log\mathbb{E}\left[\frac{1}{\deg x_1}\right] - \log\mathbb{E}\left[\frac{1}{\deg x_2}\right] ... \qquad\text{(GM-HM)}\\ &= \log |X| - \log \left( |A_1|/|X|\right) - \log \left( |A_2|/|X|\right) - ... \end{aligned}](https://s0.wp.com/latex.php?latex=%5Cbegin%7Baligned%7D+H%5Bx_1%2Cx_2%2C...%2Cx_n%5D+%26%3D+H%5Bx_1%5D+%2B+H%5Bx_2%7Cx_1%5D+%2B+H%5Bx_3+%7C+x_1%2Cx_2%5D...%5C%5C+%26%3D+%5Clog+%7CX%7C+%2B+%5Cmathbb%7BE%7D%5Cleft%5B%5Clog+%5Cdeg+x_1%5Cright%5D+%2B+%5Cmathbb%7BE%7D%5Cleft%5B%5Clog+%5Cdeg+x_2%5Cright%5D...%5C%5C+%26%5Cge+%5Clog+%7CX%7C+-+%5Clog%5Cmathbb%7BE%7D%5Cleft%5B%5Cfrac%7B1%7D%7B%5Cdeg+x_1%7D%5Cright%5D+-+%5Clog%5Cmathbb%7BE%7D%5Cleft%5B%5Cfrac%7B1%7D%7B%5Cdeg+x_2%7D%5Cright%5D+...+%5Cqquad%5Ctext%7B%28GM-HM%29%7D%5C%5C+%26%3D+%5Clog+%7CX%7C+-+%5Clog+%5Cleft%28+%7CA_1%7C%2F%7CX%7C%5Cright%29+-+%5Clog+%5Cleft%28+%7CA_2%7C%2F%7CX%7C%5Cright%29+-+...+%5Cend%7Baligned%7D&bg=ffffff&fg=7f8d8c&s=0&c=20201002) which is what we wanted.
which is what we wanted.
Remark. We made use of the QM-AM-GM-HM inequality for random variables:
![\frac{1}{2}\log \mathbb{E}[X^2] \ge \log \mathbb{E}[X]\ge \mathbb{E}[\log(X)]\ge -\log \mathbb{E}[1/X]](https://s0.wp.com/latex.php?latex=%5Cfrac%7B1%7D%7B2%7D%5Clog+%5Cmathbb%7BE%7D%5BX%5E2%5D+%5Cge+%5Clog+%5Cmathbb%7BE%7D%5BX%5D%5Cge+%5Cmathbb%7BE%7D%5B%5Clog%28X%29%5D%5Cge+-%5Clog+%5Cmathbb%7BE%7D%5B1%2FX%5D&bg=ffffff&fg=7f8d8c&s=0&c=20201002)
Entropic Lower Bounds
An alternative argument provides us a way to obtain an upper bound instead of a lower bound. We start with the following observation: if was the uniform distribution, then the  upper bound is in fact attained. This suggests that for an upper bound, we should start with the uniform distribution and then bound the entropy by various methods.
A naive way to do so (especially when joint variables are present) is to simply make use of subadditivity. If we are more careful, we could also reveal each variable sequentially and track the incremental information revealed by each variable, expressed by the equation below:

Problem. (Binomial tail bounding) Show the bound (for
 )
)
 where
where  is the binary entropy function.
Solution. Consider a random
 -bit string
  uniformly selected from the set of strings with at most 1’s. We have
 since
since  and
and  is monotonic on
 ![[0,1/2]](https://s0.wp.com/latex.php?latex=%5B0%2C1%2F2%5D&bg=ffffff&fg=7f8d8c&s=0&c=20201002) .
.
Problem. (Discrete Loomis-Whitney) Let
 be a finite subset of
  , and let
  be the projection of onto the
  -plane (with
  defined similarly). Then:

Solution. The following entropy estimate is useful (special case of Han’s inequality):
![2H[X,Y,Z] \le H[X,Y] + H[Y,Z] + H[Z,X]](https://s0.wp.com/latex.php?latex=2H%5BX%2CY%2CZ%5D+%5Cle+H%5BX%2CY%5D+%2B+H%5BY%2CZ%5D+%2B+H%5BZ%2CX%5D&bg=ffffff&fg=7f8d8c&s=0&c=20201002) This can be established by a short computation:
This can be established by a short computation:
![\begin{aligned} H[X,Y] + H[Y,Z] + H[Z,X] - 2H[X,Y,Z] &= H[X,Y] - H[X|Y,Z] - H[Y|X,Z]\\ &\ge H[X,Y] - H[X|Y] - H[Y] = 0 \qedhere \end{aligned}](https://s0.wp.com/latex.php?latex=%5Cbegin%7Baligned%7D+++++H%5BX%2CY%5D+%2B+H%5BY%2CZ%5D+%2B+H%5BZ%2CX%5D+-+2H%5BX%2CY%2CZ%5D+%26%3D+H%5BX%2CY%5D+-+H%5BX%7CY%2CZ%5D+-+H%5BY%7CX%2CZ%5D%5C%5C+++++%26%5Cge+H%5BX%2CY%5D+-+H%5BX%7CY%5D+-+H%5BY%5D+%3D+0+%5Cqedhere+++++%5Cend%7Baligned%7D&bg=ffffff&fg=7f8d8c&s=0&c=20201002) Now select
Now select  uniformly at random, then
![\begin{aligned} 2\log |S| &= 2H[P_x, P_y, P_z]\\ &\le H[P_x, P_y] + H[P_y, P_z] + H[P_z,P_x]\\ &\le \log |S_{xy}| + \log|S_{yz}| + \log|S_{zx}| \end{aligned}](https://s0.wp.com/latex.php?latex=%5Cbegin%7Baligned%7D+++++++++2%5Clog+%7CS%7C+%26%3D+2H%5BP_x%2C+P_y%2C+P_z%5D%5C%5C+++++++++++++++++++%26%5Cle+H%5BP_x%2C+P_y%5D+%2B+H%5BP_y%2C+P_z%5D+%2B+H%5BP_z%2CP_x%5D%5C%5C+++++++++++++++++++%26%5Cle+%5Clog+%7CS_%7Bxy%7D%7C+%2B+%5Clog%7CS_%7Byz%7D%7C+%2B+%5Clog%7CS_%7Bzx%7D%7C+++++%5Cend%7Baligned%7D&bg=ffffff&fg=7f8d8c&s=0&c=20201002) which is exactly log of the inequality we needed to show.
which is exactly log of the inequality we needed to show.
Discussion.
- This was proposed at the International Mathematics Olympiad 1992, a contest for high school students. How might they have solved it? Here’s a possible approach:
Alternative Solution. Let
. By the Cauchy-Schwarz inequality:
then we note that there is an injection from pairs with the same
:
.
- What are the equality cases? Looking at the computation above, we require at least:
In particular, the second equation tells us that the values for
should have the same distribution conditioned the projection onto
. The first tells us that conditioned on
forms a grid, so equality holds for “cuboidal sets”
(If you look closely, the alternative solution suggests the same equality case).
 , a triple of vertices
  is a
is a
- triangle if
are edges
- vee if
are edges
 and denonte the sets of triangles and vees respectively, show that
  .
.
Solution. Select
 uniformly at random from the set of all triangles. Then:
 where the last line has an interpretation as the entropy decrements from revealing
  in that order. However, we can ignore the dependence of
  on (i.e.
  by symmetry) to get an upper bound:
 This suggests constructing a distribution on vees as follows:
  above and
  . The result is that
  is precisely
  , but it must be upper bounded by
  .
.
Discussion. Ordinarily, when we relax
 to
to  , we would get a distribution of length-2 paths (like
  ), but we know that every triangle is a length-2 path (and so by following through, the conclusion would have been trivial). However, the magic happens when we make use of cyclic symmetry to “move” to .
Other directions
Aside from entropy, other information-theoretic concepts also have some relevance to combinatorial problems. For instance, Moser [2009] used a compression argument to prove the Lovasz local lemma, which guarantees that for a collection of independent variables and a sequence of “local” (i.e. depending only on a few variables) and “rare” bad events , all bad events are avoided with some positive probability.
Acknowledgements
I would like to thank Yanjun for his useful suggestions and advice for this project, and Professor Weissman for teaching this course and introducing me to the wonderful world of information theory.
 redundancy. In other words, to correct a single edit in a message of
  symbols, only
  where
where  .
.


 is a discrete random variable taking values in alphabet
  , then the entropy of
  . In the table below, we report the entropy of each lab test per day. For most tests, the entropy decreases over time. BUN and sodium, however, are exceptions.
 and
and  , we calculate their mutual information as follows:
  . We can use mutual information to motivate conditional entropy
  , which is the entropy of a given random variable
  .
.


