Sandy Handan-Nader
Introduction
How demographically representative is the registered voter population (RVP) of the citizen, voting-age population (CVAP) within U.S. Congressional Districts? How demographically representative is the population of active voters (AVP) of the CVAP? In this project, I used two information theoretic measures, entropy and relative entropy, to measure the demographic diversity of the CVAP, RVP, and AVP by district, and the inefficiency incurred when using the RVP and AVP to represent the CVAP. I also examined whether state voting and registration policies correlated with any observed inefficiencies.
Data
The demographic variables of interest were ethnicity (3 categories), age (4 categories), and gender (2 categories). I obtained data on the CVAP from the American Community Survey (ACS) administered by the U.S. Census Bureau in 2017. I obtained data on the RVP and AVP from the 2017 L2 voter file, accessed through Stanford libraries. I assume that missingness occurs at random in the voter file.
Table 1 shows the categories for each demographic variable available in both datasets. One notable difference between the two datasets is that the ACS uses self-reported ethnicity from survey respondents, while the voter file models ethnicity using name and Census data. I will discuss the consequences of this difference in the results section.
| Variable | Categories |
| Ethnicity | White Non-Hispanic, Hispanic, Other Non-Hispanic |
| Gender | Female, Male |
| Age | 18-29, 30-44, 45-64, 65+ |
In addition to the demographic data, I also obtained data on state voting and registration policies from the U.S. Election Assistance Commission’s 2018 survey. This survey asks states to report the type of system and technology they use to process voter registrations, as well as their policies on activities such as same-day registration, absentee voting, and others.
Methods
We can use information theory to measure diversity on any characteristic that can be broken down into separate categories. Let’s take age as an example. For any congressional district, we can count the percentage of people eligible to vote that fall into each age category. For example, in Ravenswood’s district, the percentages are:
| Category | Percentage |
| 18-29 | 18.9% |
| 30-44 | 25.2% |
| 45-64 | 33.8% |
| 65+ | 22.1% |
The entropy provides a natural way to describe the diversity of age in this population by encoding how “surprised” we would be to learn the age category of a randomly selected person. The entropy is computed as
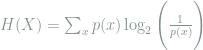
The maximum diversity possible would occur if each age category had an equal percentage of people. Then it would be the hardest to guess which category a randomly selected person would belong to, since all categories are equally likely. In this case, since we have four categories for age, maximum entropy would be 

We can also use information theory to compare the “distance” between the CVAP, RVP, and AVP on any of the demographic variables. Again using the data for Ravenswood’s district, we can see that the youngest age category is under-represented in the RVP, and the oldest age category is over-represented.
| Category | CVAP Pct. | RVP Pct. |
| 18-29 | 18.9% | 15.6% |
| 30-44 | 25.2% | 23.8% |
| 45-64 | 33.8% | 35.6% |
| 65+ | 22.1% | 25% |
We can use the relative entropy to quantify the level of divergence between the CVAP and RVP. The relative entropy is calculated as
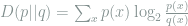
where p(x) is the CVAP and q(x) is the RVP. For this example, the calculation would be

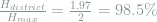
We can normalize this quantity by the CVAP entropy to express the divergence as the percent increase in baseline uncertainty incurred by using the RVP as an approximation to the CVAP.

Findings
Congressional districts are highly age and gender diverse, achieving over 90% of the maximum possible diversity for age and over 98% of the maximum possible diversity for gender. By contrast, there are distinct geographic patterns of ethnic diversity. The coastal areas and southern belt of the country are far more ethnically diverse than the northern and inland areas. Districts surrounding major cities also tend to be more ethnically diverse.

Source: American Community Survey 2017 1-Year Estimates, US Census.
The RVP and AVP tend to be less ethnically and age diverse than the CVAP. Gender diversity is very similar across the three. The diversity gaps in age and ethnicity are even bigger between the AVP and CVAP than between the RVP and CVAP. This suggests that there are distinct inefficiencies in registration and voter turnout. The figure below plots the diversity of the RVP and AVP against the diversity of the CVAP. Districts above the 45-degree line have less diversity in the RVP and AVP than in the CVAP. Note that in the plot below, the axes limits are very different, indicating vastly different baseline levels of diversity in age, gender, and ethnicity.

ethnicity (first row), age (second row), and gender (third row).
Source: American Community Survey 2017 1-Year Estimates, US Census, and the L2 Voter File for select states.
The districts with the highest ethnicity inefficiencies are ones with high percentages of Native Americans. Oklahoma’s 2nd district, for example, has the highest percentage of Native Americans in the state. The registered voters in this district are much more likely to be classified as white non-Hispanic than the eligible voters. This could also, however, reflect a problem with the way the voter file estimates ethnicity (using last name and location). Perhaps this method does not work as well for Native Americans as it does for other ethnic groups, leading Native American voters to be misclassified as white non-Hispanic.

Source: American Community Survey 2017 1-Year Estimates, US Census, and the L2 Voter File for select states.
Age inefficiencies are clearly delineated by state lines, suggesting that state policies may play a role. Wisconsin, New Hampshire, Mississippi, and Alaska all have unusually high age distortions in their registered voter population across the board (registered voters tend to be much older). Registration policies may factor into this distortion. Mississippi and New Hamsphire do not have online registration portals. Alaska and Wisconsin have online portals, but they require people to have an in-state driver’s license to register through the portal. Both these policies tend to exclude younger people from the registration process.

Source: American Community Survey 2017 1-Year Estimates, US Census, and the L2 Voter File for select states.
Outreach
For my outreach activity, I compiled the data into an interactive web application to facilitate exploration of the data. The link to the application can be found here: https://slnader.shinyapps.io/entropy-map-shiny/
Limitations
There are several limitations to this analysis that are worth discussing here. First, the CVAP estimates are measured with sampling error, which this analysis does not directly address. A certain level of inefficiency can arise from sampling error alone, although sampling error in the ACS is relatively small. Second, it seems plausible that many of the largest inefficiencies in ethnicity between the CVAP, RVP, and AVP are in part due to differences in reporting between the ACS and the voter file when it comes to Native Americans. Third, this analysis only presents estimates for 2017-2018. Future work could examine diversity and inefficiency changes over time.